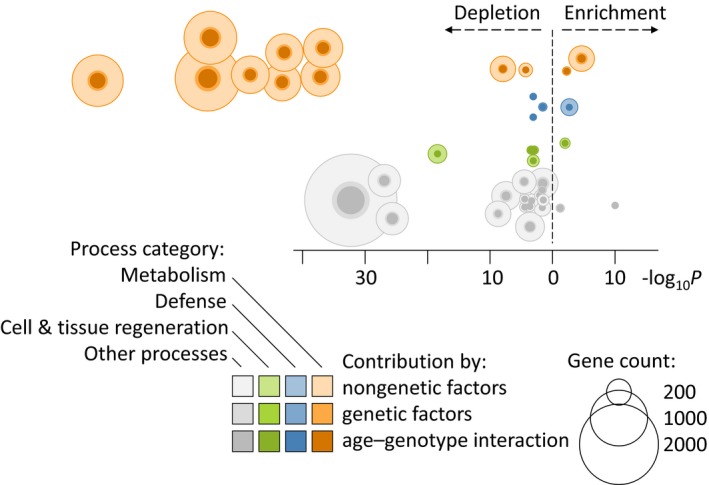
Figure 2.

Biological processes in longevity are controlled by genetic and nongenetic factors. For better readability, only processes with at least 150 genes are displayed. A strong depletion of processes associated with metabolism (orange) is the most prominent finding, while the effects on defense (blue) and cell and tissue regeneration (green) are less dominant. Processes that are not part of these three categories are displayed in grey. The contribution of age–genotype interaction (dark shading, inner circle) represents a part of the genetic contribution ( cis ‐ eQTL , middle circle), while the remaining effects (environment, epigenetics etc.) are labeled nongenetic contribution (light shading, outer circle). The y ‐axis is arranged by process category, while the x ‐axis illustrates the degree of enrichment or depletion of the individual processes (−log 10 P). The ten depleted metabolism‐associated processes are (orange, top left section, from left to right): cellular macromolecule metabolic process, regulation of metabolic process, macromolecule metabolic process, nucleobase‐containing compound metabolic process, cellular aromatic compound metabolic process, heterocycle metabolic process, organic cyclic compound metabolic process, cellular nitrogen compound metabolic process, protein metabolic process, and phosphorus metabolic process.
