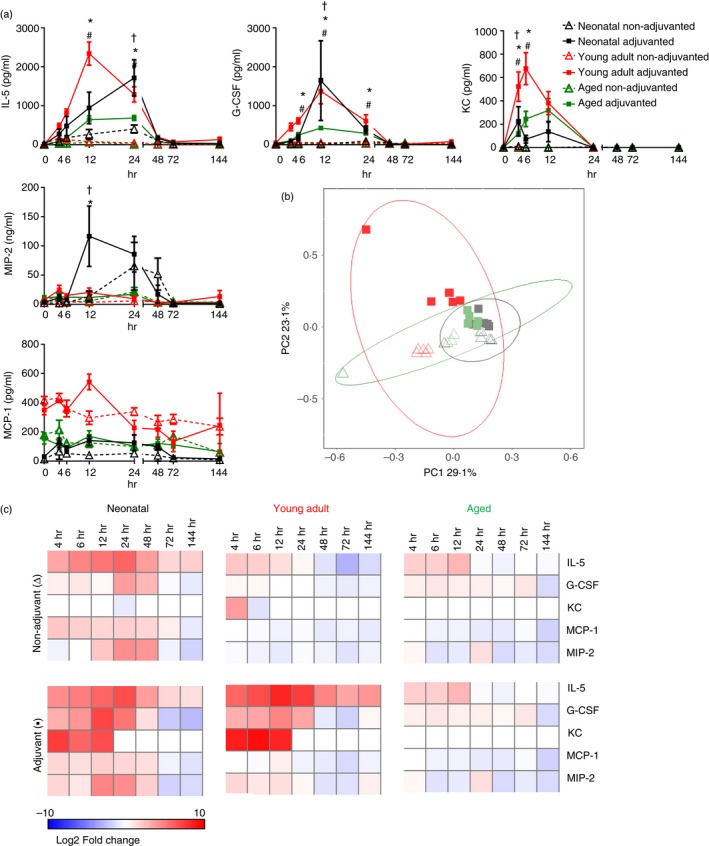
Figure 3.

Cytokine response to booster immunization. Mice received two intramuscular immunizations of influenza antigens with (▪) or without (∆) MF59, 4 weeks apart. Serum cytokine levels were measured over 6 days (a). Two‐dimensional principal component analysis was performed to visualize the overall inflammatory response over time using standardized area under the curve values of inflammatory responses (b). Heat maps of log2‐fold change from the 0 hr measurement of each group (c). Points represent mean and SEM of n ≥ 4 mice (a). Symbols represent P < 0·05 between †neonatal, * young adult or # aged animals receiving adjuvant or vaccine alone.
