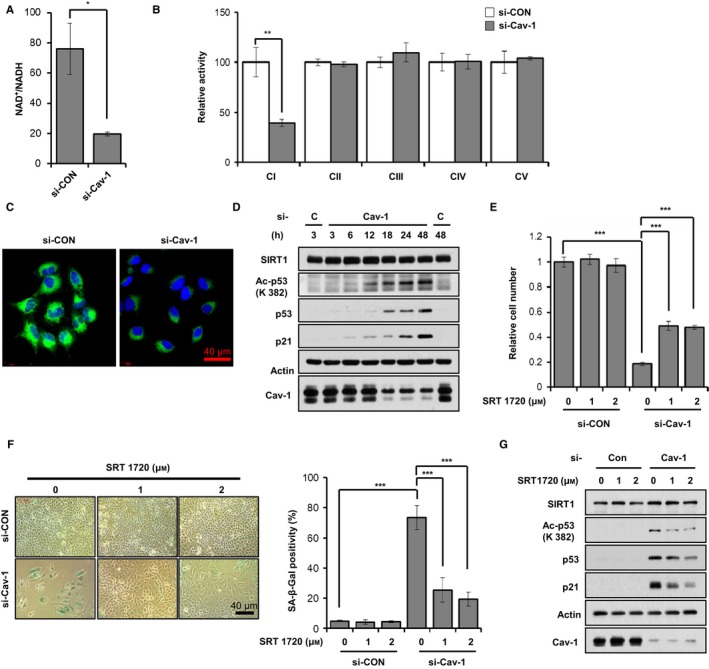
Figure 3.

Caveolin‐1 knockdown leads to mitochondrial dysfunction and SIRT1 inactivation. A549 cells were treated with 100 nM si‐CON or si‐Cav‐1 for 24 h (A–C). Intracellular NAD +/NADH ratio was measured using a quantitation colorimetric assay kit (A). CI‐CV activity levels were analyzed as described in the Experimental procedure (B). The cells were stained with 100 nm NAO for 30 min (C). A549 cells were treated with 100 nm si‐CON or si‐Cav‐1 for the indicated times. Whole cell lysates were determined by immunoblotting for SIRT1, acetylated p53 (Ac‐p53), p53, p21, and Cav‐1 using actin as a loading control (D). A549 cells were treated with 100 nm si‐CON or si‐Cav‐1 for 6 h and then treated with 1 or 2 μm SRT1720 for 3 days (E–G). Relative cell number (E) and β‐Gal staining positivity (F) were quantified, and immunoblotting was performed (G). All data are shown as the mean ± SD. Statistical significance was determined using Student's t‐test. *P < 0.05, **P < 0.01 and ***P < 0.001.
