
Figure 2.
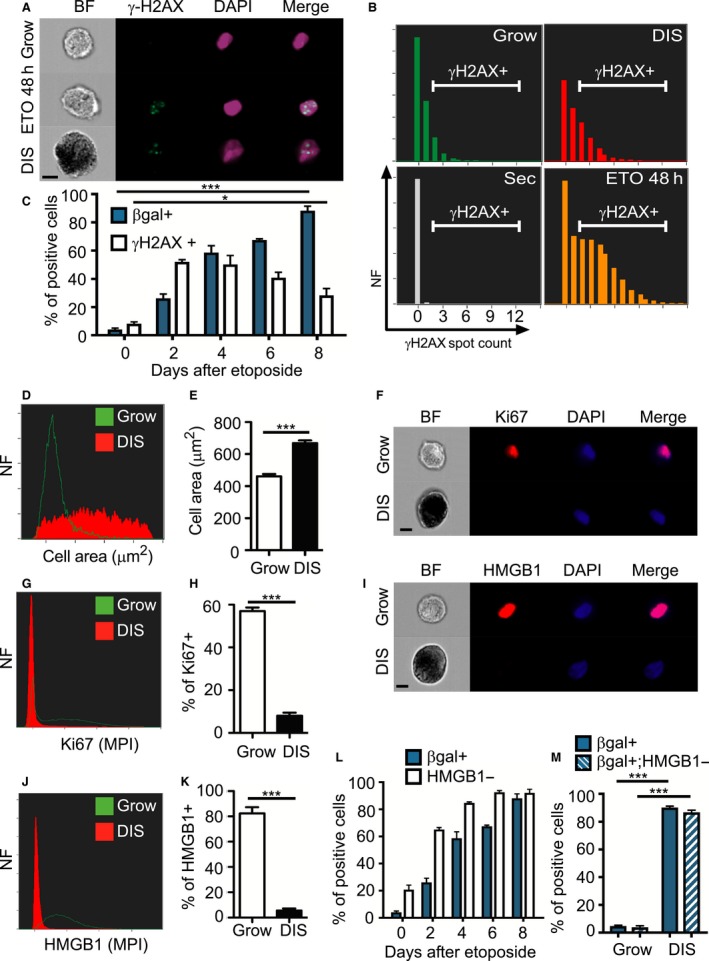
Identification of senescent cells via the combination of staining for SA‐β‐gal and molecular characteristics of senescence. (A–E) BJ cells treated with etoposide for 48 h, were harvested at the indicated times, stained for SA‐β‐gal, γH2AX (green), and DAPI (blue) and were analyzed by ImageStreamX. Control growing cells were considered time 0, cells immediately after the 48‐h treatment were considered day 2 and cells 8 days post etoposide treatment were considered as DIS. (A) Representative images of the cells stained as described above. Bar, 10 μm. (B) Distribution of numbers of γH2AX foci in these cells. DIS cells stained with the secondary antibodies only and DAPI served as a negative control (Sec). (C) Quantification of γH2AX‐positive and SA‐β‐gal‐positive BJ cells, as gated in (B), at different time points following initiation of etoposide treatment. (D) Representative histogram shows cell area distribution of DIS and growing BJ cells. (E) Quantification of cell area. (F–M) Growing and senescent BJ cells were stained for DAPI (blue) and Ki67 or HMGB1 (red) and were analyzed by ImageStreamX. Bar, 10 μm. (F) Representative images of the cells stained for Ki67. (G) Representative histogram presents max pixel intensity of Ki67 in DIS and growing BJ cells. (H) Quantification of Ki67‐positive BJ cells. (I) Representative images of cells stained for HMGB1. (J) Representative histogram showing mean pixel intensity of HMGB1 in DIS and growing BJ cells. (K) Quantification of HMGB1‐positive BJ cells. (L) Quantification of HMGB1‐negative and SA‐β‐gal‐positive BJ cells. n ≥ 3 (M) Quantification of the overlap between SA‐β‐gal staining and HMGB1‐negative staining. (A–C) Values are means ± SEM, n = 4 performed in two independent experiments. *P < 0.05, ***P < 0.001 (Student's t‐test). (E,H,K,M) Values are mean ± SEM, n ≥ 5, and were replicated in two independent experiments. ***P < 0.001 (Student's t‐test or two‐way ANOVA). NF = Normalized frequencies.