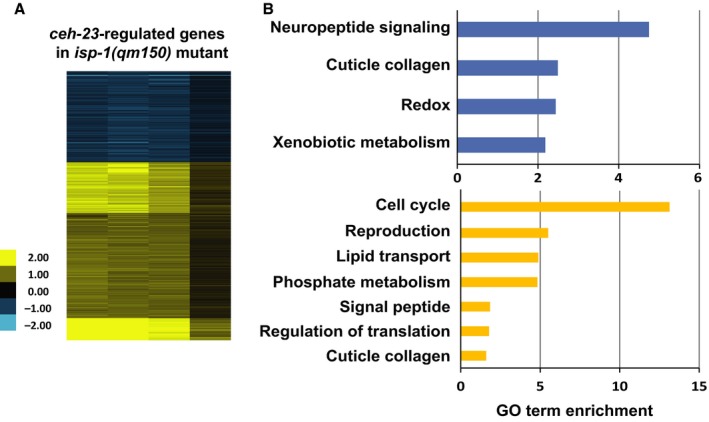
Figure 2.

Transcriptomic targets of CEH‐23. (A) The heat map shows the genes whose expression changes significantly between the isp‐1(qm150) mutant compared to the ceh‐23(ms23); isp‐1(qm150) double mutant. Gene changes were identified by Statistical Analysis of Microarray (SAM) one‐class analysis false discovery rate (FDR) = 0, fold change > 1.5). Genes downregulated in isp‐1 relative to ceh‐23; isp‐1 are shown in blue and genes upregulated are shown in yellow. The intensity of the heat map represents the log2 ratio of the expression comparison. The significant gene lists are presented in Table S2 (Supporting information). (B) The most enriched Gene Ontology (GO) terms among the CEH‐23‐upregulated genes (yellow bars) and CEH‐23‐downregulated genes (blue bars). X‐axis represents GO term enrichment scores.
