Figure 3.

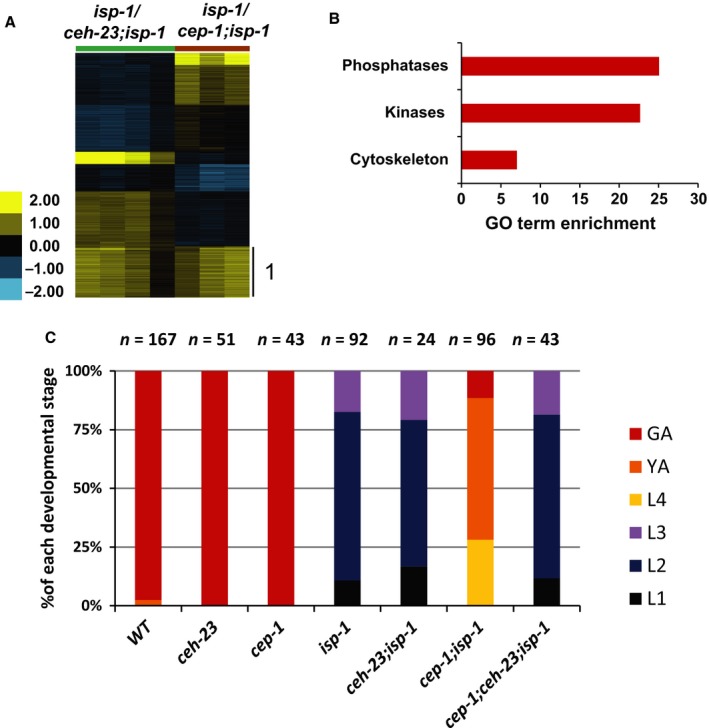
Transcriptomic analyses revealed that CEH‐23 and CEP‐1 co‐regulate a large set of genes in response to electron transport chain (ETC) dysfunction. (A) Genomewide comparison of expression changes between isp‐1(qm150) and ceh‐23(ms23); isp‐1(qm150) or cep‐1(gk138); isp‐1(qm150). The common targets of CEH‐23 and CEP‐1 in the isp‐1 mutant false discovery rate (FDR = 0%, fold change > 1.5 fold) are indicated as Cluster 1. Gene clustering was performed using K‐mean clustering with K = 7. The intensity of the heat map represents the log2 ratio of the expression comparison. The isp‐1(qm150) vs. cep‐1(gk138);isp‐1(qm150) microarray were performed in the Baruah et al. study. (B) The most enriched Gene Ontology (GO) terms among the CEH‐23 and CEP‐1 common targets. X‐axis represents GO term enrichment scores. Gene lists used for the GO terms analysis are presented in Table S3 (Supporting information). (C) Postembryonic developmental phenotypes of the indicated strains (wild‐type, ceh‐23(ms23), cep‐1(gk138), isp‐1(qm150), ceh‐23(ms23);isp‐1(qm150), cep‐1(gk138);isp‐1(qm150), cep‐1(gk138);ceh‐23(ms23);isp‐1(qm150)). Bar graph shows the fraction of each developmental stage 60 h after egg lay for each genotype. The sample size (n numbers) for each genotype is denoted above the bar graph. (L1‐L4: larval stage 1–4, YA: young adults, GA: gravid adults.)
