Figure 4.

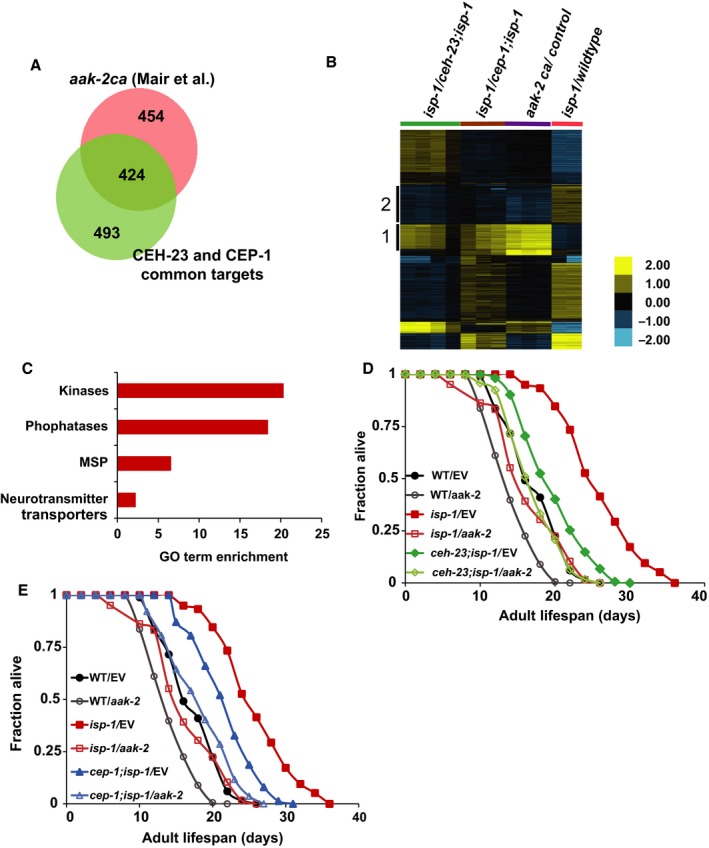
CEH‐23, CEP‐1, and AAK‐2 act in the same pathway to mediate isp‐1 mutant lifespan. (A) The Venn diagram shows a substantial overlap between the genes that are commonly regulated by CEH‐23 and CEP‐1 in the isp‐1 mutant and those regulated by constitutively active AAK‐2 (aak‐2 ca) (Representation factor: 7.0; P < 0.000e+00). The representation factor and P‐value (determined by hypergeometric probability test) were calculated using the web‐based tool (http://nemates.org/MA/progs/overlap_stats.html). The aak‐2ca microarray data are obtained from Mair et al., 2011 ; (B) The heat map represents a genomewide comparison of expression patterns between isp‐1(qm150) vs. ceh‐23(ms23); isp‐1(qm150) or cep‐1(gk138); isp‐1(qm150), aak‐2ca vs. transgenic control (data from Mair et al., 2011), and isp‐1(qm150) vs. wild‐type. Genes without significant differences in any of the pairwise comparisons have been filtered out. Genes are grouped using K‐mean clustering with K = 7. Cluster 1 highlights genes that are commonly regulated by CEH‐23, CEP‐1, and AAK‐2, and Cluster 2 highlights genes that shared targets between CEH‐23 and AAK‐2. (C) The most enriched Gene Ontology (GO) terms among the CEH‐23, CEP‐1, and AAK‐2 common targets. X‐axis represents GO term enrichment scores. Gene lists for the GO terms are presented in Table S5 (Supporting information). ceh‐23; isp‐1 (D) and cep‐1; isp‐1 (E) mutants treated with aak‐2 RNAi had similar lifespan as the isp‐1 single mutant treated with aak‐2 RNAi, suggesting that ceh‐23 and cep‐1 and aak‐2 act in the same genetic pathway to modulate isp‐1 mutant lifespan.
