
Figure 5.
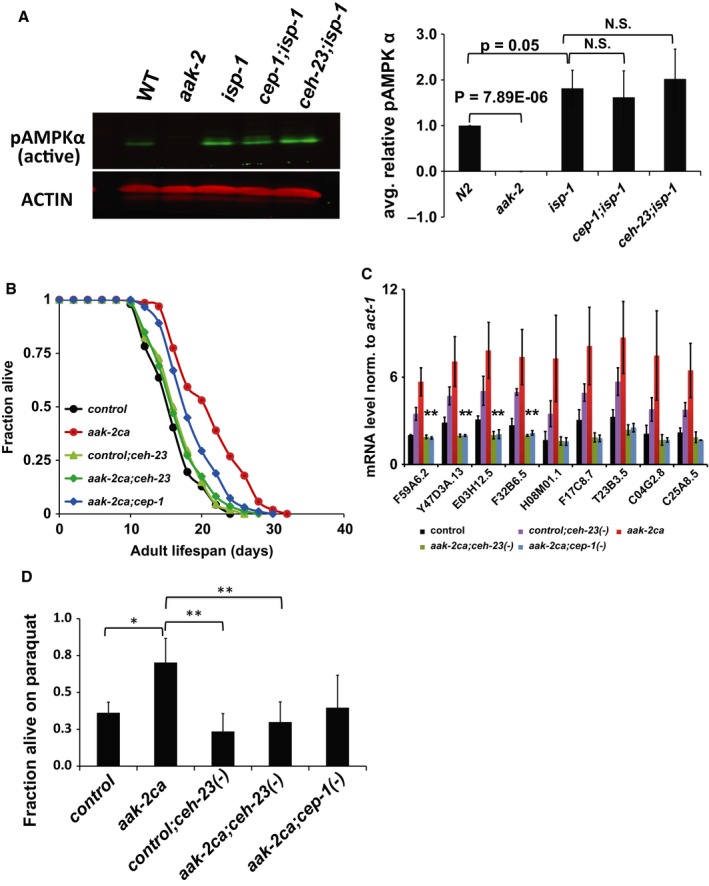
CEH‐23, CEP‐1 act downstream of AAK‐2/AMPK signaling. (A) Western blot analysis showed that activated AAK‐2 levels are similarly elevated in the isp‐1 single mutant and in the ceh‐23; isp‐1 and cep‐1; isp‐1 double mutants. Quantified pAAK‐2/AMPKα levels from three independent experiments are presented in the bar graph. Both ceh‐23 and cep‐1 mutations suppressed the extended lifespan (B), transcriptional response (C), and oxidative stress resistance (D) of aak‐2ca worms. In (D), P‐value is represented as following: *< 0.05, **< 0.01. Although the difference in oxidative stress resistance between aak‐2ca; cep‐1(‐) and aak‐2ca is not significant, we consistently observed this difference in all our trials. aak‐2ca refers to WBM60 and control refers to WBM59. Our attempt to introduce the cep‐1 mutation into the control strain was not successful, so only control strain carrying the ceh‐23 mutation was included in this experiment.