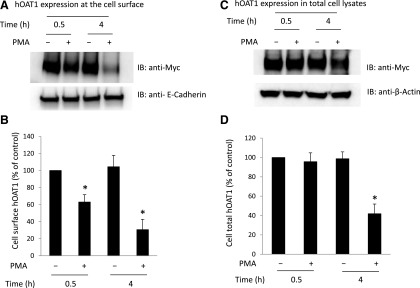
Fig. 1.
Comparison of the short- and long-term effects of PKC on hOAT1 expression at the cell surface and in total cell lysates in COS-7 cells. (A) hOAT1 expression at the cell surface. (Top panel) hOAT1-expressing cells were treated with or without PKC activator PMA for 30 minutes and 4 hours, respectively. Cell surface biotinylation was then performed. Biotinylated/cell surface proteins were separated with streptavidin beads and analyzed by immunoblotting (IB) with an anti-myc antibody (myc was tagged to hOAT1 for immuno-detection). (Bottom panel) The same immunoblot from the top panel was reprobed by anti-E-cadherin antibody to determine the expression of the cell surface protein marker E-cadherin. (B) Densitometry plot of results from (A, top panel) as well as from other independent experiments. The values are mean ± S.E. (n = 3). *P < 0.05. (C) hOAT1 expression in total cell lysate. (Top panel) hOAT1-expressing cells were treated with or without PKC activator PMA for 30 minutes and 4 hours, respectively. Treated cells were lysed, and hOAT1 total expression was analyzed by IB with an anti-myc antibody. (Bottom panel) The same immunoblot from the top panel was reprobed by cell protein marker anti-β-actin antibody. (D) Densitometry plot of results from (C, top panel) as well as from other independent experiments. The values are mean ± S.E. (n = 3). *P < 0.05.

