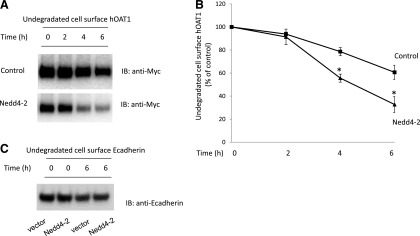
Fig. 5.
Effect of Nedd4-2 on the degradation rate of cell surface hOAT1. (a) hOAT1-expressing cells were transfected with control vector or with Nedd4-2. Transfected cells were biotinylated with membrane impermeable biotinylation reagent sulfo-NHS-SS-biotin. Labeled cells were then put in the cell incubator at 37°C for 2, 4, and 6 hours, respectively. Cells were lysed afterward and cell surface proteins were isolated using streptavidin-agarose beads, followed by immunoblotting (IB) with anti-myc antibody. (B) Densitometry plot of results from (A) as well as from other independent experiments. The values are mean ± S.E. (n = 3). *P < 0.05 (between Nedd4-2-transfected and control at the same time point). (C) hOAT1-expressing cells were transfected with control vector or Nedd4-2. Transfected cells were biotinylated with membrane impermeable biotinylation reagent sulfo-NHS-SS-biotin. Labeled cells were then put in the cell incubator at 37°C for 6 hours. Cells were lysed afterward and cell surface proteins were isolated using streptavidin-agarose beads, followed by IB with anti-E-cadherin antibody.

