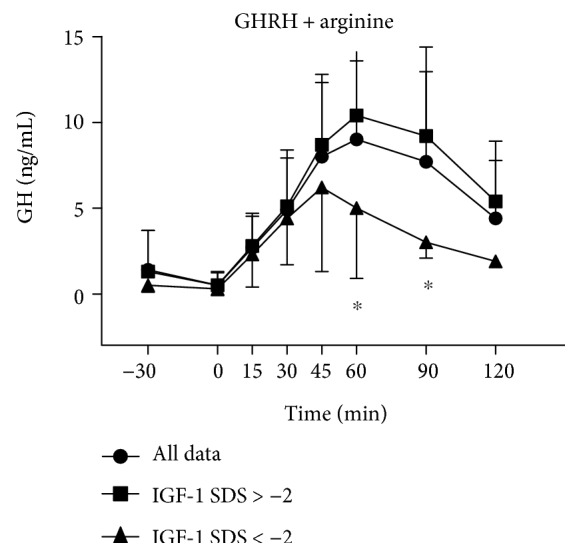
Figure 1.

Serum concentrations of GH in FM obese patients (all data and subjects with normal or low IGF-1 SDS values), who underwent the combined GHRH plus arginine test. Data are expressed as mean ± SD. Please note that GH levels were significantly higher at T30, T45, T60, and T90 versus T0 (p < 0.01) when considering all data and the two subgroups with normal or low IGF-1 SDS values. ∗p < 0.05 versus the corresponding time point of the group with normal IGF-1 SDS values.
