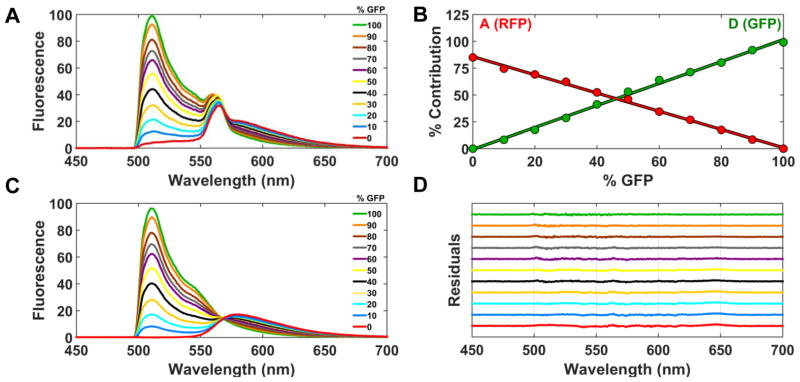
Figure 2.
Analysis of mixtures of GFP- and RFP-expressing stable cell lines. (A) Cells expressing a GFP-only control construct were mixed with cells expressing a RFP-only control construct in a 384-well plate. The % of GFP cells was varied as indicated, but the total volume and number of cells remained constant. The observed spectrum of each GFP mixture is shown (average from 32 wells). Each observed spectrum was fit using linear least-squares minimization to determine the four scalar coefficients (Eq. 3), and the results are plotted in (B), showing that the fluorescence contributions of GFP and RFP to the emission spectrum vary inversely and linearly. (C) shows the results of A after subtracting contributions from autofluorescence and Raman. (D) shows the residuals from fits in B, offset vertically for clarity.

