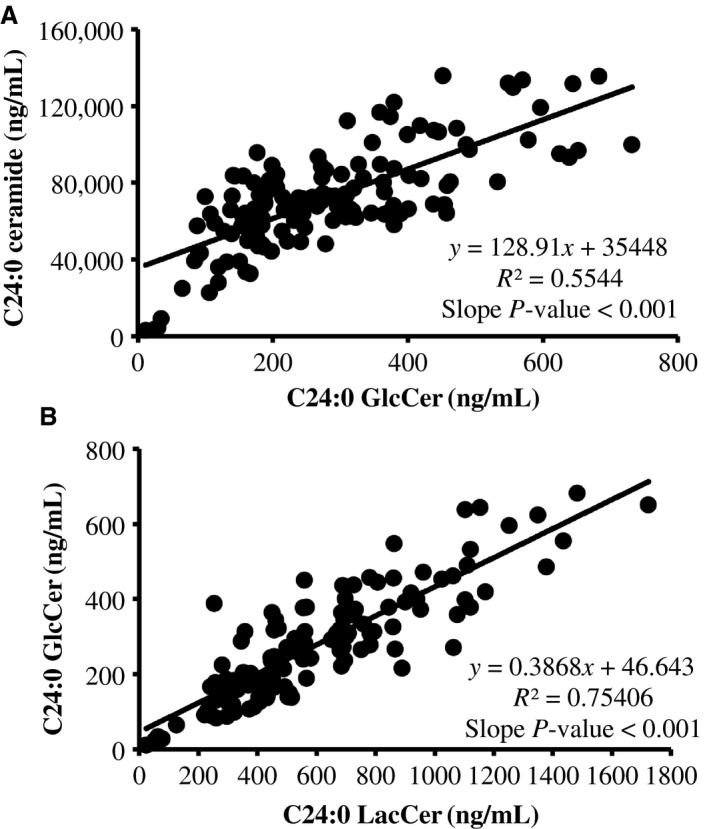
Figure 8.

Random regression analysis between serum concentrations of (A) C24:0 ceramide and monohexosylceramide (GlcCer), and (B) C24:0 GlcCer and lactosylceramide (LacCer). Coefficients of determination (R2) represent the association between observed and model predicted values. Data represent measurements for week 0, 2, 5, and 8 relative to the start of interventions.
