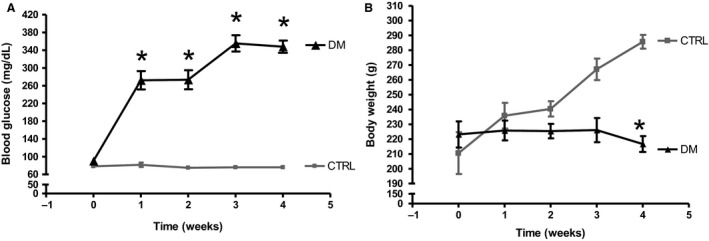
Figure 2.

Glycemic levels and body weight of rats in the CTRL and DM groups during the 4 weeks of the experiments. (A) After 5 h fasting, the rats in the DM group showed higher glycemia than those in the CTRL group throughout the experimental timeline. (B) The body weight of DM rats was lower than the CTRL rats (n = 6) in the fourth week of the experiment. All values were compared each week and are presented as means ± SEM. Asterisk (*) indicates a significant difference; CTRL vs. DM (P < 0.05). CTRL, n = 6; DM, n = 8.
