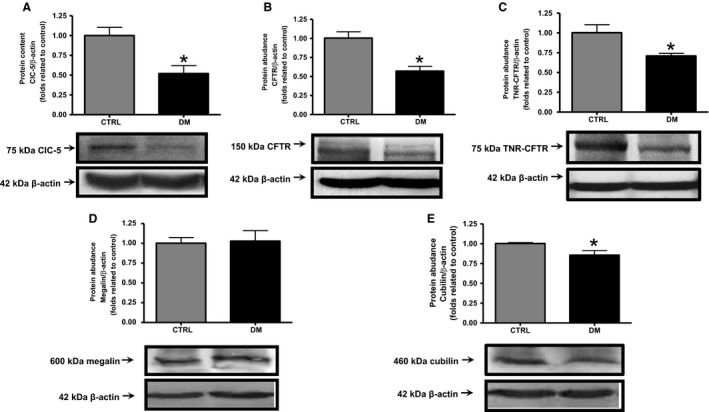
Figure 4.

Analyses of ClC‐5, CFTR, TNR‐CFTR, megalin, and cubilin protein content in the renal cortex of CTRL and DM rats. The abundance of key proteins of the endocytic pathway in the renal cortex was measured by western blotting. Graphical representation of the protein content of (A) ClC‐5, (B) CFTR, (C) TNR‐CFTR, (D) megalin, and (E) cubilin. The values are presented as means ± SEM and as fold relative to control. Asterisk (*) indicates a significant difference; CTRL versus DM (P < 0.05). β‐Actin expression was used as an internal control. CTRL, n = 6; DM, n = 6.
