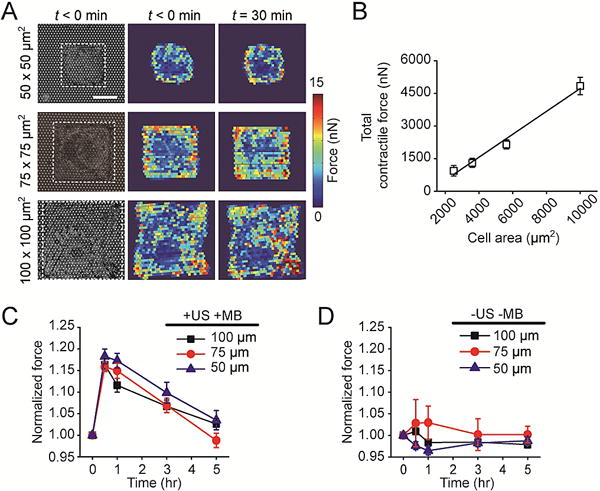
Figure 2.

ATC is effective in modulating cytoskeletal contractile force of hMSCs with different cell areas. (A) Bright field images showing micropatterned single hMSCs on the PDMS micropost array (PMA) with different cell areas as indicated. Subcellular cytoskeletal contractile force distributions before (t < 0 min) and 30 min after ultrasound (US) stimulation were shown for the same single cells. White rectangles in micrographs highlight cell boundaries. Scale bar, 30 μm. (B) Total cytoskeletal contractile force of micropatterned single hMSCs before US stimulation as a function of cell area. A linear function (black line) was used for fitting, R2 = 0.9817. (C&D) Dynamic evolution of total cytoskeletal contractile force of single hMSCs with different cell areas (normalized to pre-US application values). C, cells were loaded with MBs before being stimulated with US (+ US +MB). D, control group without MBs and US stimulation (−US −MB). Error bar denotes SEM, with n = 6–10. US parameters: frequency 1 MHz, pulse repetition frequency 10 Hz, pulse duration 50 ms, treatment duration 30 s, and acoustic pressure 0.08 MPa.
