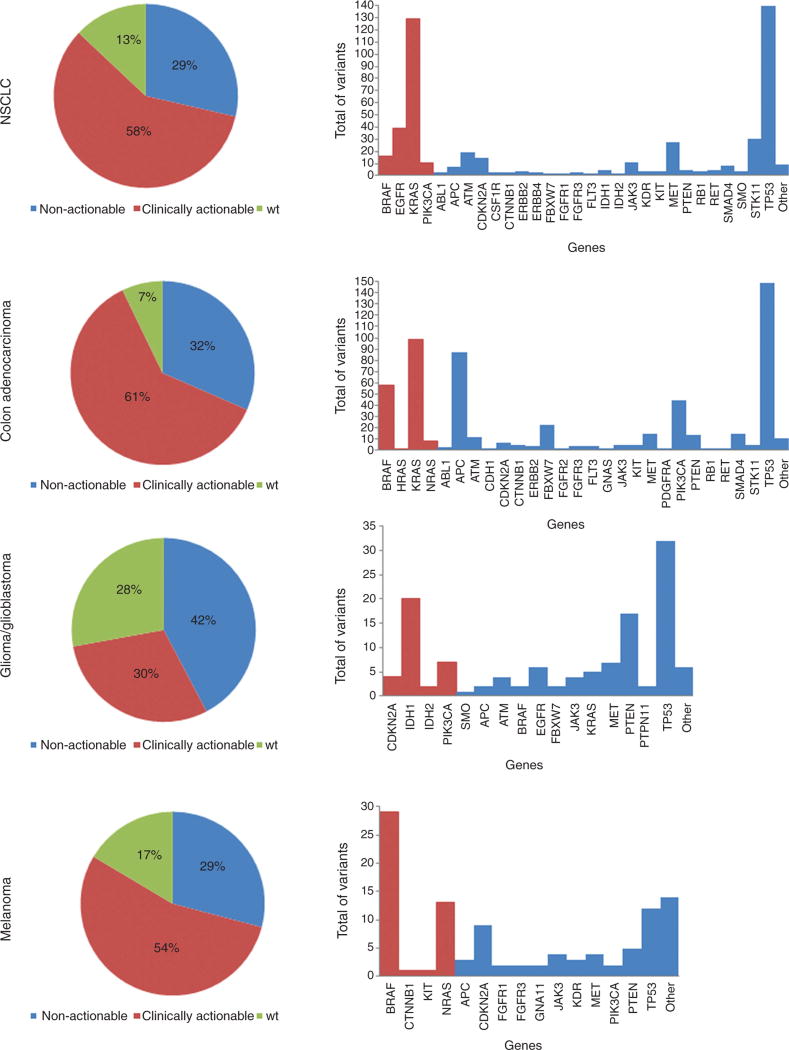
Figure 4.
Variants detected in clinically actionable and non-actionable genes in each tumor type.
The color “red” represents the clinically actionable genes, and the color “blue”, the non-actionable genes. The pie chart graphs represent the classification of the samples into one of the three groups: absence of mutations (wild-type: wt), presence of only clinically actionable mutation(s), and presence of only non-actionable mutation(s). The bar graphs represent a profile of all mutated genes identified in all samples. In the non-actionable category, genes with only one mutation detected were grouped into “other”.

