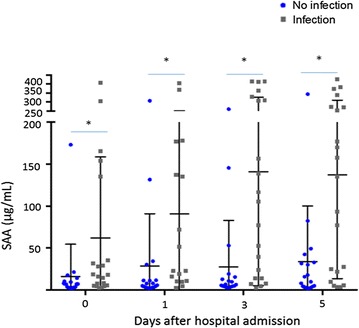
Fig. 2.

Kinetics of SAA concentrations at hospital admission, 1, 3, and 5 days after stroke onset. Text under Fig. 2 in PDF: SAA concentrations are shown by grey square for infected patients and by blue square for non-infected patients. Comparisons between the two groups were made using the Mann–Whitney U test. Asterisk significance level reported after the Bonferroni correction (p < 0.05)
