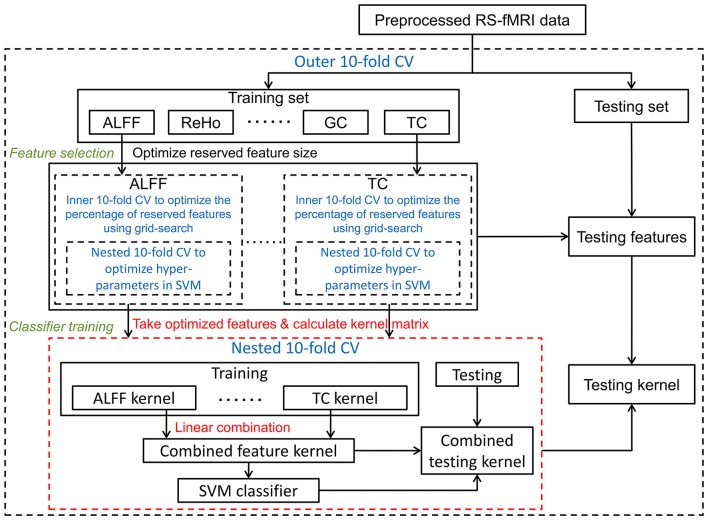
Figure 2.
Optimized framework of kernel combination: kernel matrices were calculated separately on each optimized feature set, and were then linearly combined as a final kernel. Cross-validation parts are in blue font and dashed lines. To distinguish it from the other two frameworks, the kernel combination part is illustrated in red.

