. 2015 Aug 11;6(11):6607–6613. doi: 10.1039/c5sc01925g

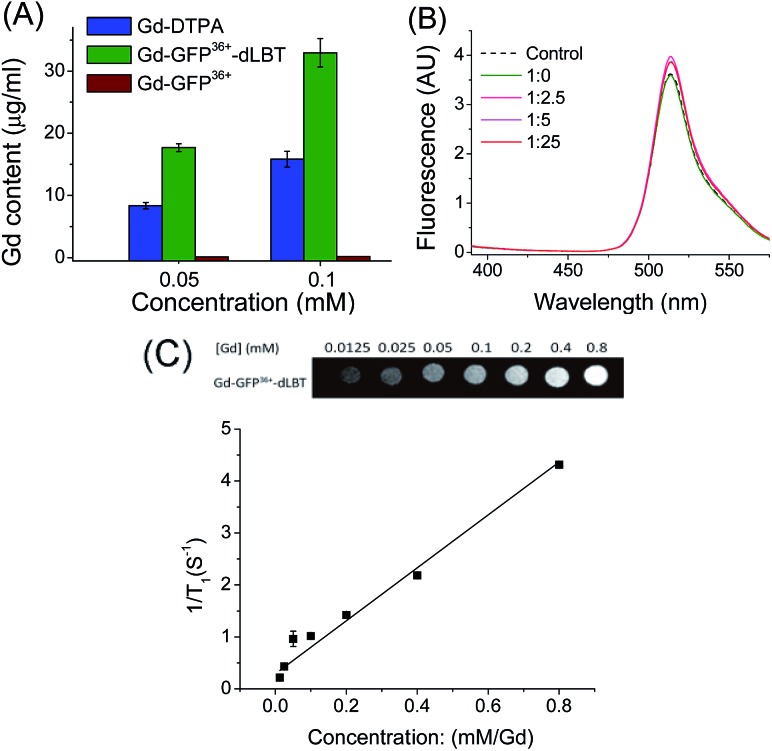
Fig. 1. In vitro characterization of the GFP36+–dLBT protein. (A) ICP-MS measurement of the Gd(iii) content in Gd-DTPA (blue), Gd–GFP36+–dLBT (green) and Gd–GFP36+ (brown). Both GFP36+–dLBT and GFP36+ proteins contain a (His)6 tag. (B) Fluorescence spectra of GFP36+–dLBT with Gd3+ titration. The dashed line denotes the GFP36+ control; the solid lines indicate the 10 μM GFP36+–dLBT with the addition of Gd3+ ions. The molar ratios of [protein] : [Gd3+] are given. The spectra were recorded in HEPES buffer from 400–580 nm with an excitation wavelength of 395 nm. (C) T1-weighted MR image produced with a spin echo sequence (TR 300 ms, TE 14 ms) of the GFP36+–dLBT protein at different concentrations of gadolinium. The molar relaxivity rates, r1 (1/T1), were obtained by linear fitting of the experimental data. Error bars denote the standard deviation.

Fig. 1