
Figure 3.
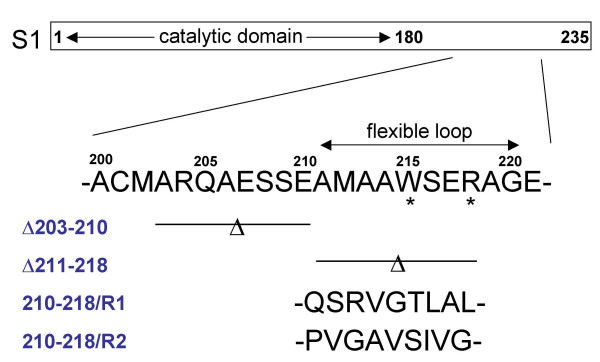
Diagram of the S1 protein and the putative cleavage site. The region of investigation between A200 and E221 is highlighted and details of some of the mutant constructs are shown. The line with a Δ symbol indicates the deleted amino acids.
Official websites use .gov
A
.gov website belongs to an official
government organization in the United States.
Secure .gov websites use HTTPS
A lock (
) or https:// means you've safely
connected to the .gov website. Share sensitive
information only on official, secure websites.
Diagram of the S1 protein and the putative cleavage site. The region of investigation between A200 and E221 is highlighted and details of some of the mutant constructs are shown. The line with a Δ symbol indicates the deleted amino acids.