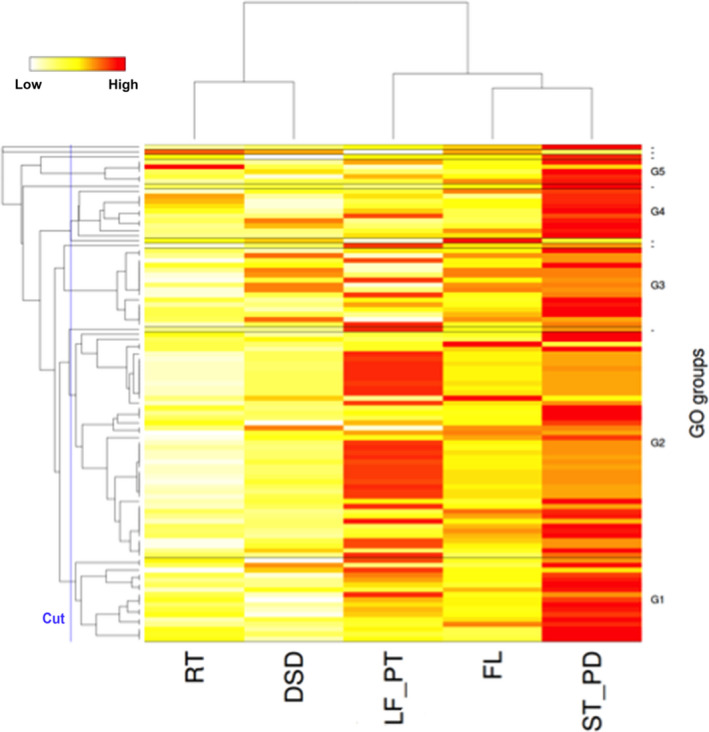
Figure 3.

Heat map showing hierarchical clustering of tissues based on global gene expression and GO terms. Clustering was based on 100 genes with highest sum of all TPM (transcripts per million) of the five tissue types. The dendrogram of the selected genes [vertical axis] is visualized along with the expression patterns that are used to cluster the five tissue samples, i.e. root (RT), developing seed (DSD), leaf and petioles (LF_PT), stem and peduncles (ST_PD) and flower (FL) [horizontal axis]. There are five GO‐based clusters named G1…G5 that contain more than one gene. The GO clusters are separated by a horizontal bar in the heat map. Genes without annotations are omitted from the heat map. Highly expressed genes are shown with red colour and lower expressed genes with white or yellow colour, respectively.
