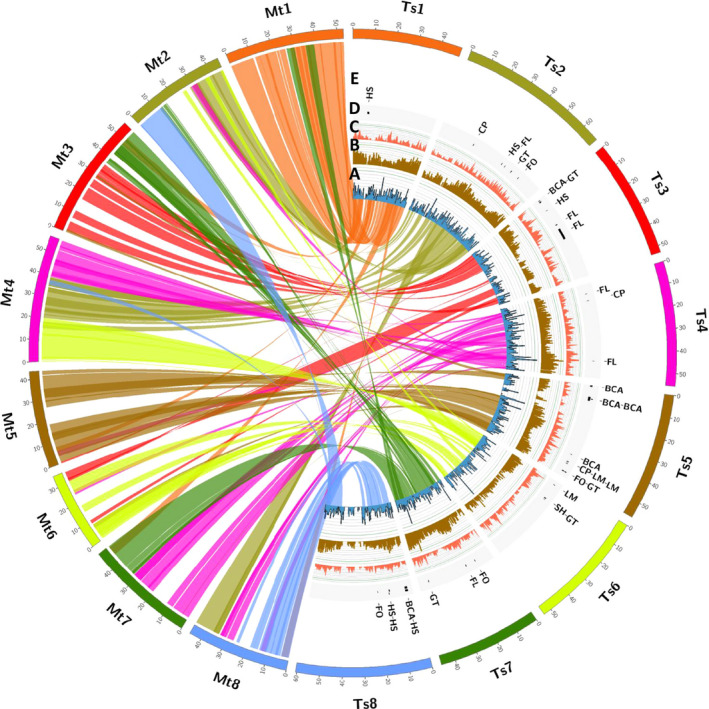
Figure 6.

Graphical view of the genome structure of Trifolium subterraneum L. A) Syntenic relationship between Medicago truncatula (left) and T. subterraneum (right) with synteny links and synteny density histograms; B) T. subterraneum gene densities C) T. subterraneum SNP densities; D) T. subterraneum QTLs mapped for important traits using the high‐density SNP linkage map E) Names for the QTLs mapped for important traits using the high‐density SNP linkage map [FL Flowering time, LM Leaf marks, CP Calyx pigmentation, SH Stem Hairiness, FO Formononetin, GT Genistein, BCA Biochanin A and HS Hardseededness].
