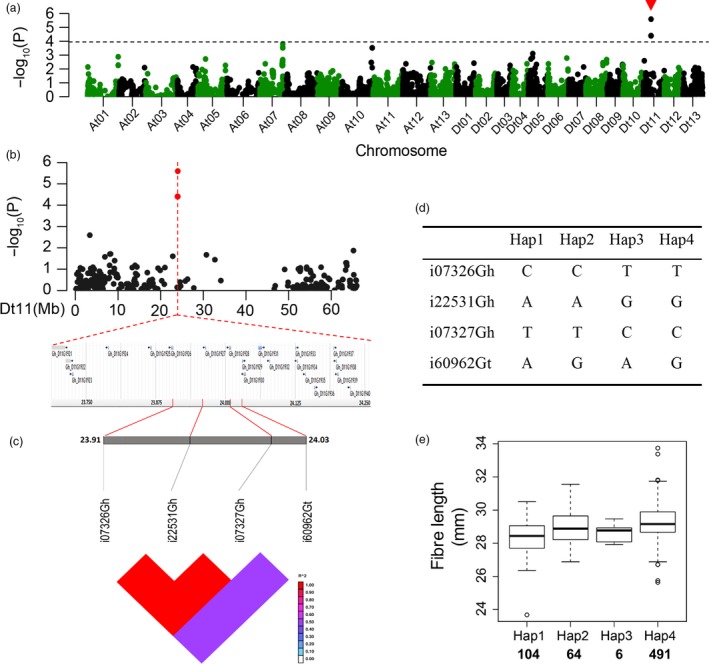
Figure 4.

GWAS results for fibre length and analysis of the peak on chromosome Dt11. (a) Manhattan plots for fibre length. The dashed line represents the significance threshold (P < 10−3.97). The arrowhead indicates the position of the strong peak investigated in this study. (b) Manhattan plot (top) and genes surrounding the peak (bottom) on chromosome Dt11. (c) Genomic location of four SNP loci and LD based on pairwise R2 values between the SNPs estimated in Dt11. The R2 values are indicated using the colour bar. (d) Haplotypes observed in 719 accessions using the four SNPs. (e) Phenotypic differences of fibre length among four haplotypes.
