Fig. 2.

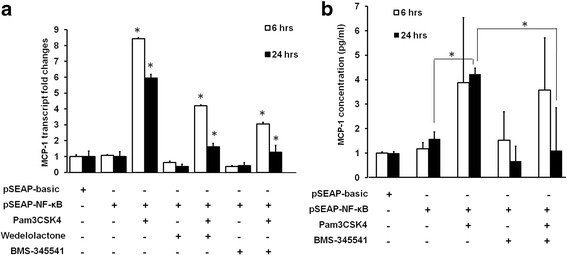
MCP-1 transcript and protein expression in HCE-T cells. a qPCR results of MCP-1 transcript levels in control HCE-T cells, and in HCE-T cells transfected with pSEAP-basic or pSEAP-NF-κB, either stimulated or un-stimulated with Pam3CSK4, treated or un-treated with IκK inhibitors, Wedelolactone and BMS-345541. GAPDH was used as the housekeeping control. b MCP-1 protein concentration in various cell culture media. Cell culture media were collected from cells transfected with pSEAP-basic or pSEAP-NF-κB with various treatment. ELISA was used to determine MCP-1 protein concentration. The means of two independent experiments are shown. Error bars represent standard error of the means. *: P < 0.05
