Figure 5.
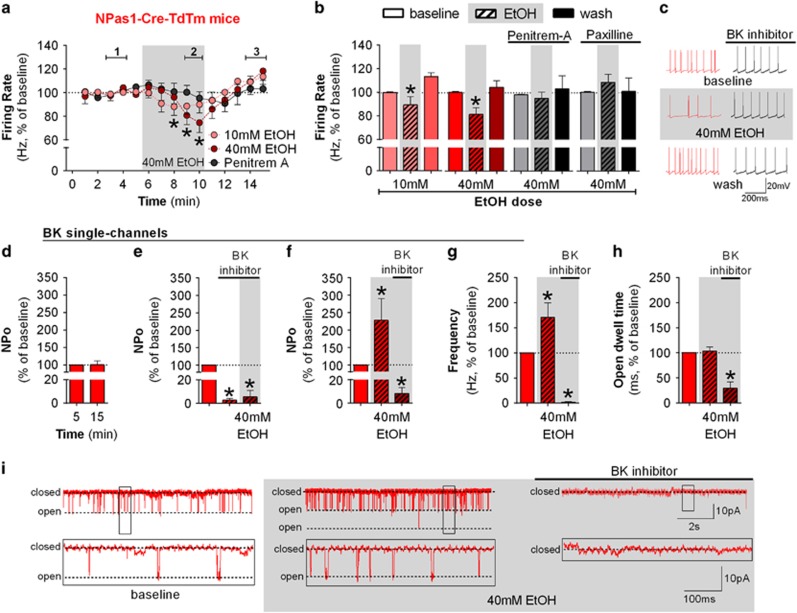
Npas1 marks a subpopulation of ethanol-sensitive neurons in the GPe which express ethanol-sensitive BK channels. (a) Time course of firing rate of Npas1-Cre-TdTm-positive neurons during the application of 10 mM ethanol (n=6 neurons from 6 mice, F(14,70)=3.70, p<0.05, post hoc test indicates lower firing rate in minutes 8–9 when compared with minutes 1–2 and 4–5), 40 mM ethanol (n=5 neurons from 6 mice, F(14,70)=2.41, p<0.05, post hoc test indicates lower firing rate in minutes 9–10 when compared with minutes 2–4), and 40 mM ethanol in the presence of 500 nM penitrem-A (BK channel blocker, n=5 neurons from 3 mice, F(14,56)=9.82). Application of 40 mM ethanol decreased the firing rate of Npas1-positive neurons (*p<0.05). (b) Summary bar graph of Npas1 neurons during baseline, ethanol, and washout calculated as average from time segments 1, 2, and 3 indicated in time-course graph. Ethanol dose-dependently decreased the firing rate of Npas1 neurons in GPe (*p<0.05). Either 500 nM penitrem-A or 1 μM paxilline (another BK channel inhibitor, n=6 neurons from 4 mice) blocked the ethanol effect. (c) Representative traces of Npas1 neurons during baseline, 40 mM ethanol, and washout. Firing rate in time courses and bar graphs are represented as percentage of the baseline levels. (d) Single-channel recordings in a Giga-seal cell-attached configuration are stable for 5–20 min as the open probability (NPo) did not change over time (n=5 patches from 5 mice). (e) Graphs showing NPo values before and during bath application of 3 uM penitrem-A or paxilline and the subsequenct addition of 40 mM EtOH. The BK inhibitors significantly decreased NPo (n=5 patches from 4 mice; *p<0.05), and in this condition ethanol had no effect (n=4 patches from 3 mice). (f) Graph showing BK channel NPo before and during bath application of 40 mM ethanol followed by the application of 3 μM penitrem-A or paxilline. Application of 40 mM ethanol increased NPo (n=6 patches of 5 mice; *p<0.05), which was then inhibited by subsequent application of the BK inhibitor (n=6 patches of 4 mice; *p<0.05). (g) Graph showing the frequency of opening transitions before and during bath application of 40mM ethanol followed by the application of 3μM penitrem-A or paxilline. The increase in NPo induced by ethanol is driven by an increase in the frequency of opening transitions of BK channels. (h) Graph showing open dwell time before and during bath application of 40mM ethanol followed by the application of 3μM penitrem-A or paxilline. No change in dwell time of BK channel was observed after ethanol application. (i) Example traces showing single-channel recordings. Trace in the bottom of the panel is expanded on the time and current axes relative to those above. All error bars represent SEM.

