Figure 1.

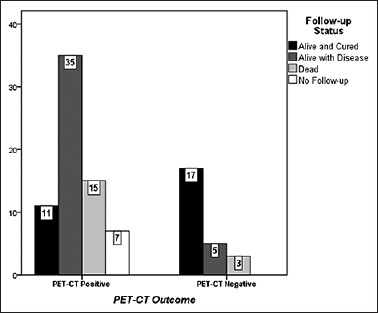
Comparison of follow-up status between posttreatment fluorodeoxyglucose positron emission tomography-computed tomography positive and negative groups

Comparison of follow-up status between posttreatment fluorodeoxyglucose positron emission tomography-computed tomography positive and negative groups