
Fig 3.
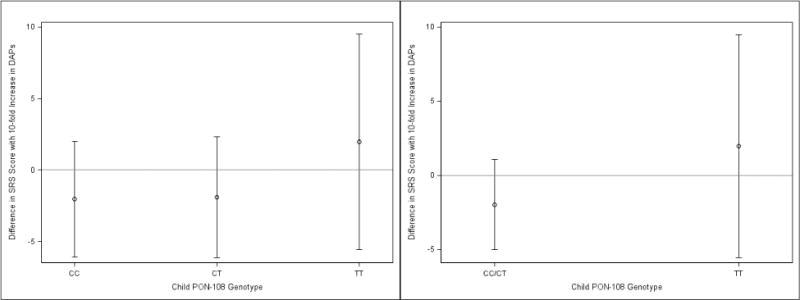
Adjusted mean change in SRS Scores per 10-fold Increase in maternal ΣDAPs: Stratified by child PON1−108.a,b,c, a- Adjusted for maternal race, age, education, marital status, household income, health insurance, maternal depression, parity, prenatal vitamins, child sex, maternal serum cotinine concentrations, and frequency of fresh fruit and vegetable consumption during pregnancy. b-Effect measure modification p-values for three and two category PON1−108 equal to 0.61 and 0.33, respectively, c-N’s for CC, CT, and TT equal to 96, 76, and 34, respectively.