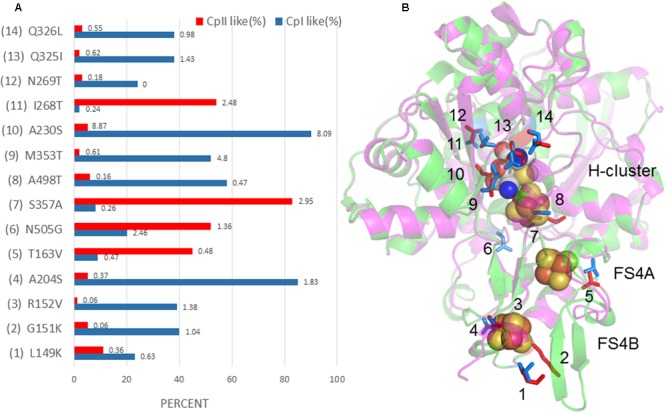
FIGURE 5.

(A) Percent conservation of either CpI- or CpII-type residues among 829 [FeFe]-hydrogenase sequences is displayed in blue and red, respectively, along the X-axis. The Y-axis displays sites corresponding to the model depicted in (B), where CpII is superimposed with CpI, and 14 sites have been identified that may tune the FeS cluster potential. Residues are numbered according to CpI. The number at the end of each bar in (A) is the K-value, or phylogenetic signal, that corresponds to the amino acid at that position. A value of 1 or greater shows a high degree of phylogenetic signal, or conservation, and can be interpreted to indicate that this residue is under strong selective pressure.
