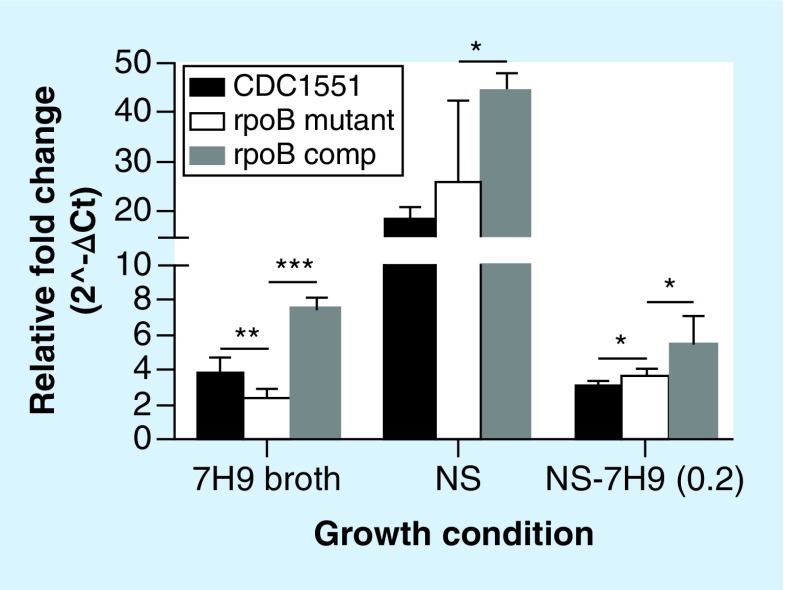
Figure 4. . Expression of the Mycobacterium tuberculosis rpoB gene during exponential growth in nutrient-rich broth, during nutrient starvation and upon resuscitation, as measured by RT-qPCR.
The CT of rpoB gene was normalized to that of sigA under each growth condition to calculate ΔCT followed by conversion of relative fold change (2∧-ΔCT) in the rpoB mutant and control strains.
*p < 0.05; **p < 0.01; ***p < 0.001.
comp: Complemented strain of the RpoB H526D mutant; CT: Cycle threshold; mutant: RpoB H526D mutant; NS: Nutrient-starved; NS-7H9 (0.2): Resuscitated NS cultures in 7H9 broth at OD600nm = 0.2.

