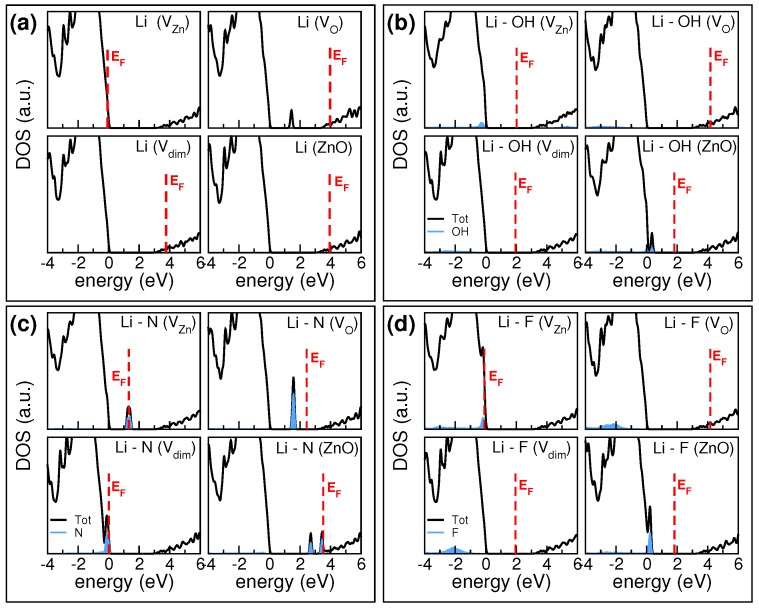
Figure 3.
Density of states (DOS) plots of LXZO compounds for selected Li-X dopants: (a) Li; (b) Li-OH; (c) Li-N; (d) Li-F. For each dopant, DOSs corresponding to the four possible hosts are displayed. Zero energy reference is set to the valence band maximum of ZnO. Red vertical lines identify the resulting Fermi level of the doped systems. Cyan shaded areas represent the X-codopant contributions due to total DOS.

