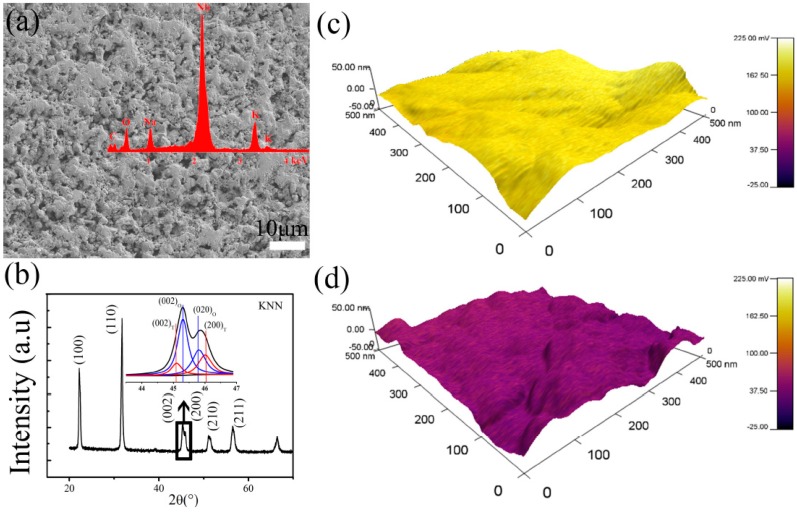
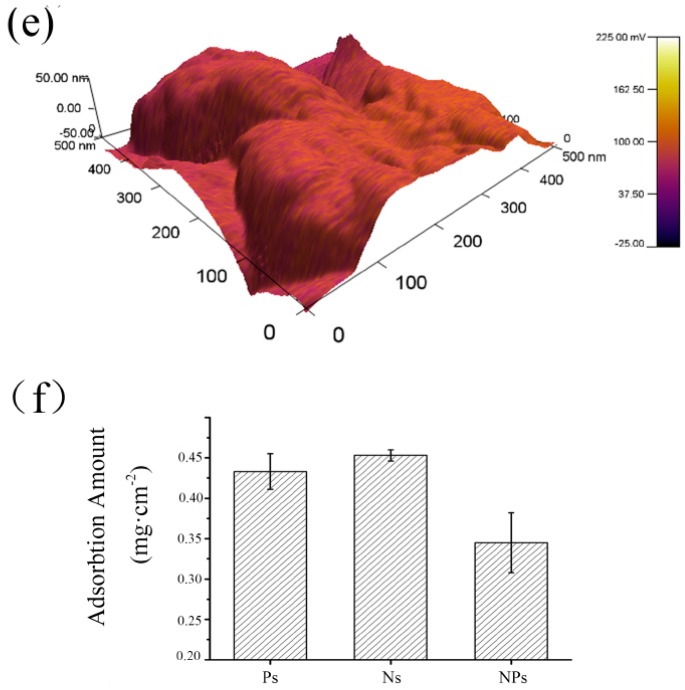
Figure 5.
(a) SEM image of KNN ceramic with energy-dispersive X-ray spectroscopy (EDS) results inserted; (b) XRD pattern of the KNN ceramic including the insert of detail in the 2θ from 44.2° to 47°, which were fitted to the sum of four peaks indexed as two tetragonal peaks (in red) plus two orthorhombic peaks (in blue) of the perovskite phase; the surface potential by scanning Kelvin probe microscopy (SKPM) and protein adsorption behavior on three different KNN ceramic surfaces: (c) on positive surface (Ps); (d) on negative surface (Ns) and (e) on non-polarized surface (NPs); (f) the results of bovine serum albumin (BSA) protein adsorption.


