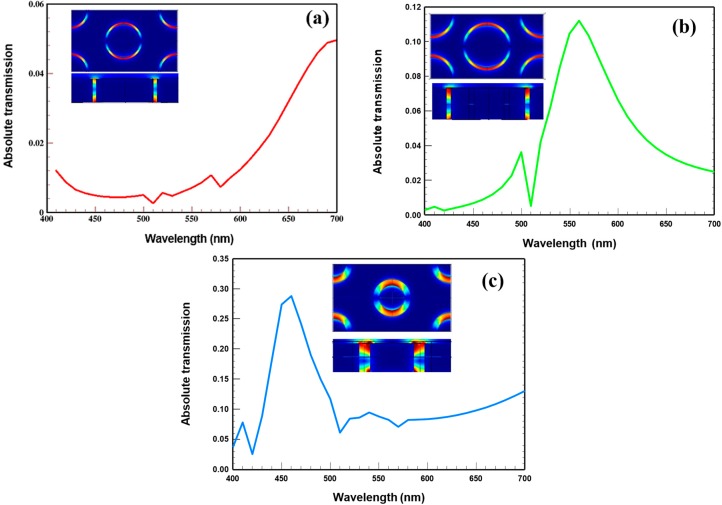
Figure 1.
Simulated transmission spectrum for (a) red (R1–130 nm, R2–121 nm, and pitch 430 nm); (b) green (R1–130 nm, R2–106 nm, and pitch 430 nm); and (c) blue (R1–130 nm, R2–80 nm, and pitch 430 nm) plasmonic colour filters. The inset in each plot shows normalised electric field and cross-section of a coaxial hole (CH) for red, green, and blue at 700 nm, 560 nm, and 480 nm, respectively (TE11 modes).

