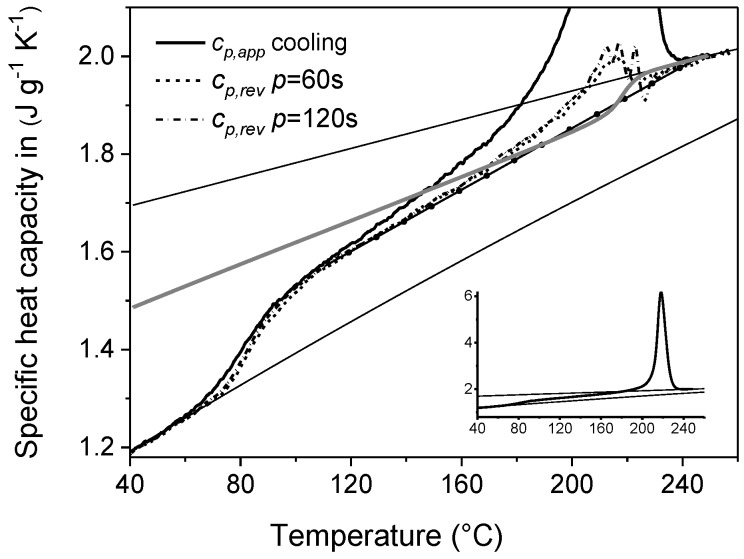
Figure 16.
Apparent specific heat capacity (cp,app) by standard DSC and reversing specific heat capacity (cp,rev) of PET at modulation period of 60 s and 120 s, measured upon cooling from the melt at 2 K min−1 (AT = 1.0 K). The black solid line with circles is the approximate linear baseline, whereas the solid grey line is the two-phase baseline (cp,base,2phase). The black thin solid lines are the solid and liquid specific heat capacities of PET, as taken from [40]. The inset shows the entire cp,app curve. (Reprinted (adapted) with permission from [37]. Copyright (2014) Elsevier).

