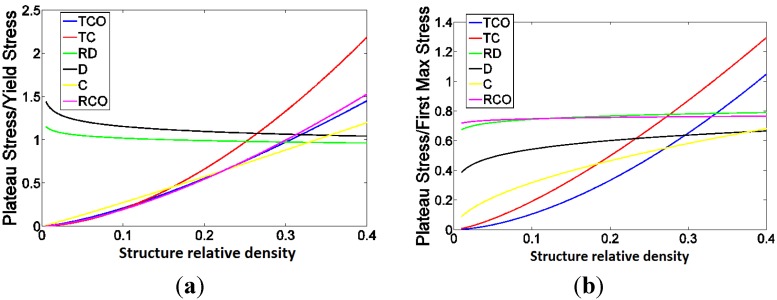
Figure 15.
(a) The ratio of plateau stress to yield stress as well as (b) the ratio of plateau stress to first maximum stress for different types of unit cells. In these figures, the power laws fitted to the experimental data points, and not the experimental data points themselves, are compared with each other.

