Figure 6.
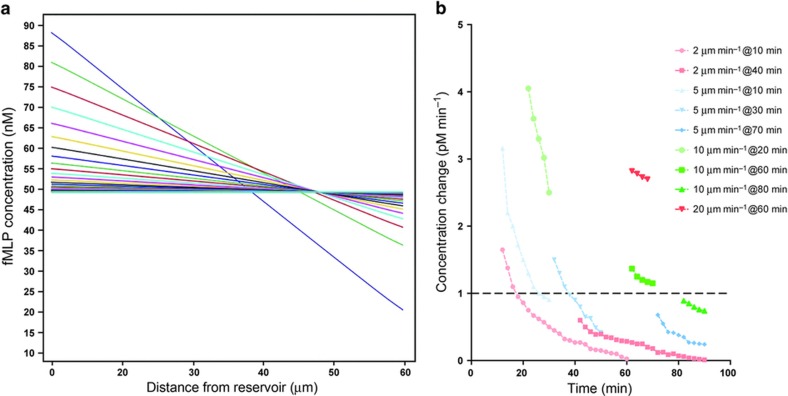
Integration of spatial and temporal cues during cell chemotaxis in an evolving chemoattractant gradient. (a) Modeling the chemoattractant gradient evolving over time. The gradient evolves quickly at first, then more slowly, as it approaches 0.1 pM μm−1 slope at ~180 min. Lines represent the gradient at 10 min time interval, starting at 10 min after introducing the neutrophils, up to 120 min. (b) Modeling the change in concentration experienced by neutrophils migrating and different speeds and entering the channels at different times after the start of the experiment. Faster cells experience concentration changes above the 1 pM min−1 threshold even when entering the channels late (for example, 20 μm min−1 at 60 min). Slower cells entering early also experience concentration changes above the threshold for the entire duration of migration, but only when they enter the channels early (for example, 5 μm min−1 at 10 min). Slowest moving cells experience concentration changes above threshold only when they enter channels early, and for a short duration of time (for example, 2 μm min−1 at 10 min).

