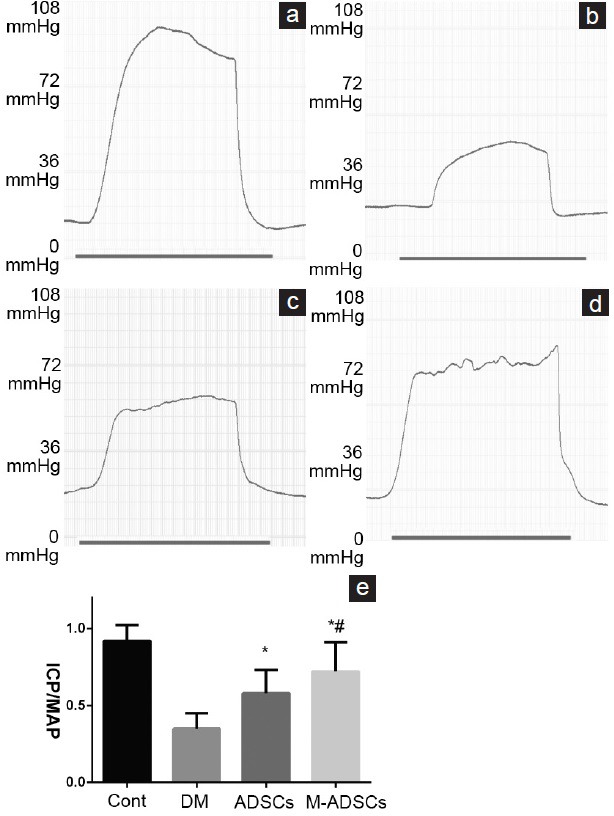
Figure 4.

Erectile function evaluation. (a–d) Representative recording of ICP in response to electrostimulation of the cavernous nerve. (e) Results of erectile function expressed as the ICP/MAP ratio. *P < 0.05 compared with DM; #P < 0.05 compared with ADSCs. Cont: normal control group; DM: diabetic group; ADSCs: ADSC-treated group; M-ADSCs: magnetic-targeted group. ICP: intracavernous pressure; MAP: mean arterial pressure.
