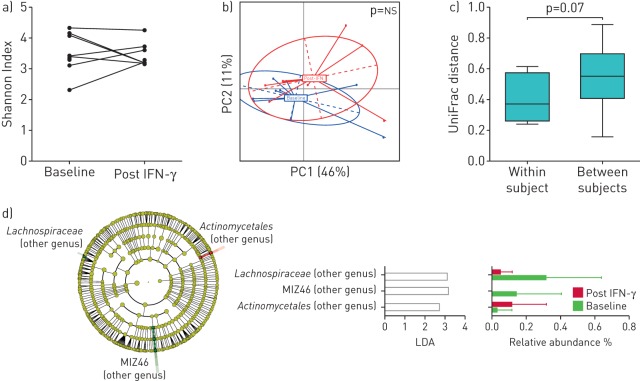
FIGURE 2.
Microbiomic changes during inhaled interferon (IFN)-γ. a) Comparison of α diversity (based on the Shannon Index where sequences were rarified at 1000 reads per sample) before and after treatment. b) Changes in β diversity (based on UniFrac distances) before and after IFN-γ (p-value based on PERMANOVA (permutational multivariate ANOVA)). PC: principal coordinate; ns: nonsignificant. c) β diversity distance (based on UniFrac distances) between pairs of samples comparing within subject (before–after IFN-γ) versus between subjects (p-value based on Mann–Whitney test). d) Linear discriminant analysis (LDA) effect size was calculated comparing 16S rRNA data at baseline and after IFN-γ.

