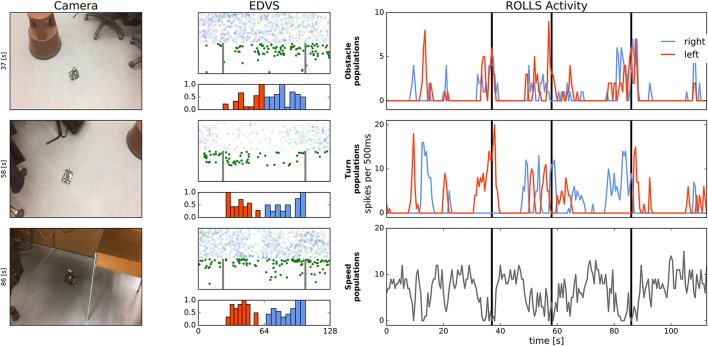
Figure 13.
Robot driving in the office environment. Left: Snapshots from the video camera showing robot at three time points during the experiment. Middle: Events from the DVS camera and histogram of these events, binned over 500 ms in columns in the region between two vertical lines, which were used to drive obstacle populations on the ROLLS. Each pair of the eDVS events and histogram corresponds to the time point of the video frame in the Left column. Note that 80% of events are randomly dropped here and only “on” events are shown in the relevant region (lower part of the screen). Events above the midline of the image sensor are shown with transparency (these events were not used for obstacle avoidance). Right: Activity of the obstacle (left and right), drive (left and right), and speed neuronal populations over time (summed activity across each population). Vertical lines mark time point that correspond to the video frames in the Left column.

