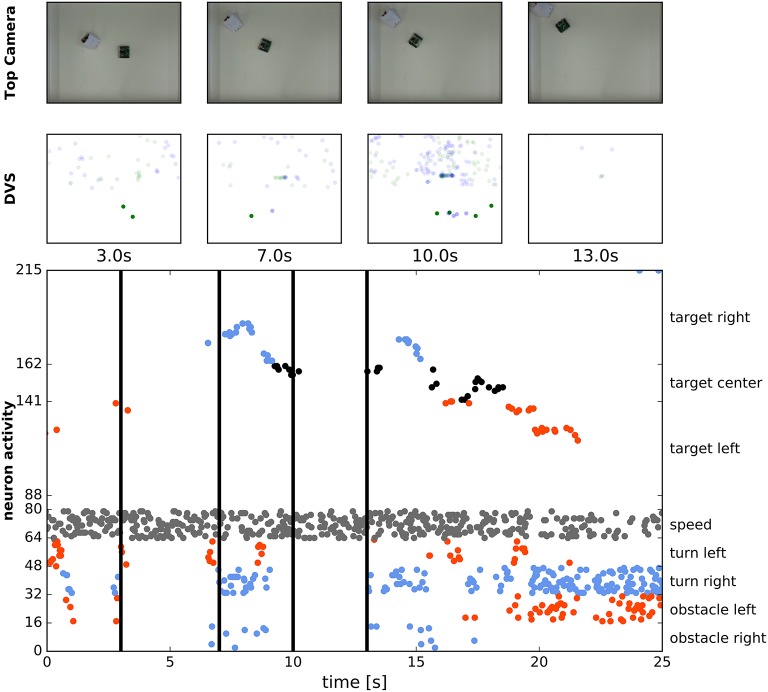
Figure 15.
Chasing a moving target. First row: Snapshots from the overhead camera showing the robot controlled by the ROLLS chip chasing a manually controlled robot. Second row: Summed eDVS events from 500 ms time windows around the same moments. Events from the upper part were used for target acquisition, events from the lower part—for obstacle avoidance. Bottom row: Spiking activity of all neurons on the ROLLS chip over the time of the experiment. Vertical line show the moments in time, selected for the first two rows. Red dots are spikes from the “left” populations and blue dots are spikes from the “right” populations.

