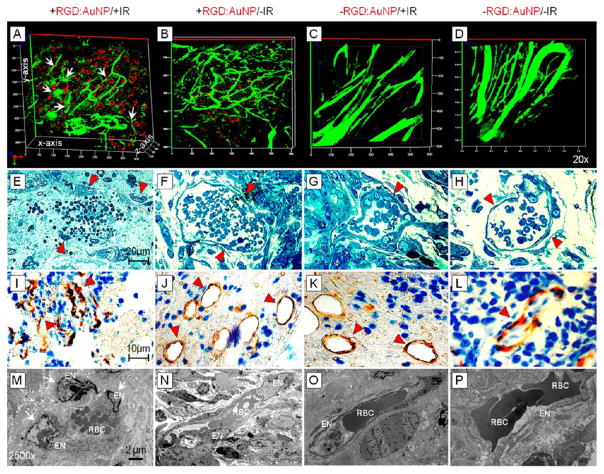
Figure 6.
Imaging tumor vascular disruption. (A–D) Confocal imaging with RGD:AuNP (red) and FITC-Dextran (green) shows a high degree of vascular damage at the indicated locations (white arrows) and the presence of highly dense RGD:AuNPs in its close proximity, compared to the respective controls. (E–H) Bright field imaging shows damaged endothelial cells, and a change in the morphology of red blood cells clearly demonstrates loss of functionality for some of these vessels. The control samples showed intact vessels and prominent endothelium. (I–L) CD34 IHC shows collapsed vessels and altered morphology (red marker) compared to the respective controls. (M–P) TEM imaging clearly confirms the endothelial rupture (see arrows). In the +RGD:AuNP/+IR samples, endothelial cells were detached and the cell nuclei damaged. The control samples showed high integrity and intact morphology. EN: Endothelial nucleus; RBC: red blood cells; BM: basement membrane.

