
Figure 2. Optogenetic and chemogenetic modulation of somatostatin interneurons.
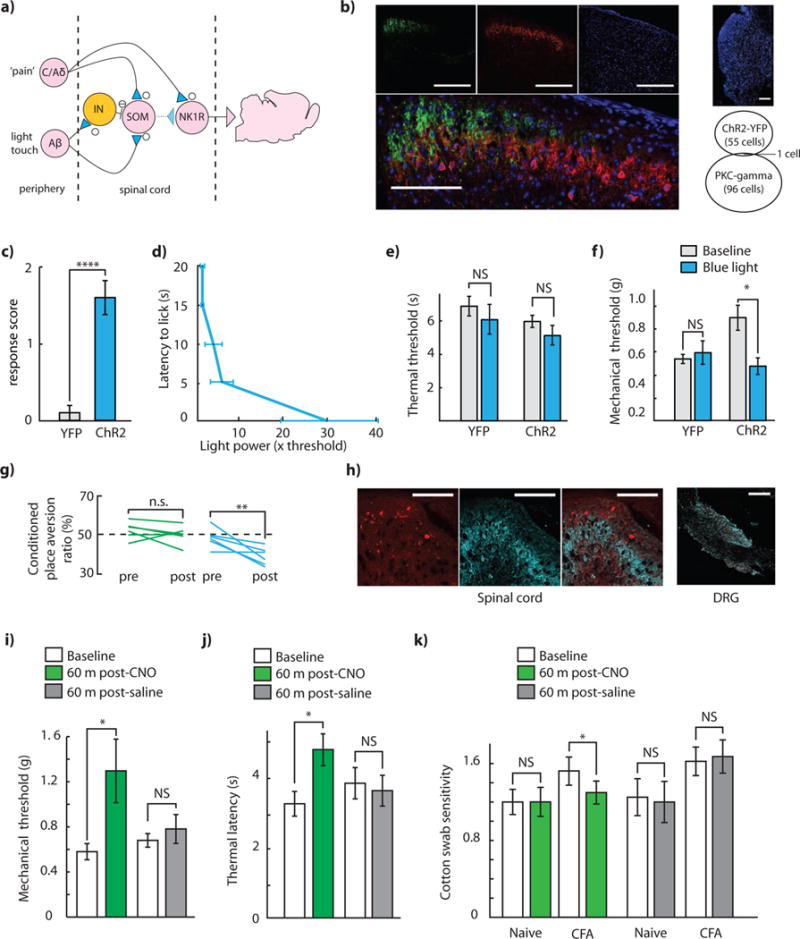
(a) Diagram of primary afferent to brain circuit containing somatostatin interneurons. Hypothesized and/or polysynaptic connection shown in dotted lines. (b) Histology showing somatostatin expression (sections from n = 3 mice were examined for quantification). Scale bar: 250 μm, inset: 100 μm. (c) Spontaneous response score of YFP mice compared to ChR2 mice in somatostatin interneurons (n = 5 ChR2, 5 YFP, P = 4×10⁻⁴). (d) Latency to lick response of somatostatin mice vs. threshold light power (n = 7 mice, each normalized to their individual threshold, binned in 5 second intervals, and then averaged across mice). (e) Thermal withdrawal latency during ‘subthreshold’ blue light illumination of YFP mice and ChR2 mice (n = 5 ChR2, 5 YFP. P = 0.1 YFP, P = 0.21 control). (f) Mechanical withdrawal thresholds of YFP and ChR2 mice at baseline and during subthreshold blue light illumination (n = 5 ChR2, 5 YFP. P = 0.421 YFP, P = 0.0173 ChR2). (g) Conditioned place aversion (CPA) ratios, calculated as the ratio of the percentage of time spent in the stimulation chamber on initial (pre-test) day, and after three days of conditioning (n = 6 ChR2, 6 YFP. ChR2: P = 0.006, control: P = 0.208). (h) Histology indicating robust expression of hM4D in the spinal cord dorsal horn following intraspinal injection of AAV5::hM4D, indicating expressing in lamina II that is non-overlapping with PKCγ. Top row, transverse spinal cord section: hM4D-mCherry (red), PKCγ (cyan), overlap. Scale bar: 100 μm. Bottom row, dorsal root ganglion section: hM4D-mCherry (red), DAPI (cyan). Scale bar: 250 μm. (i) Mechanical withdrawal thresholds following injection of CNO or saline in SOM-hM4D+ mice (n = 8 post-CNO, n = 8 post-saline, P (post-CNO) = 0.013, P (post-saline) = 0.52). (j) Thermal withdrawal latency following injection of CNO or saline in SOM-hM4D+ mice (n = 7 post-CNO, n = 7 post-saline, P (post-CNO) = 0.047, P (post-saline) = 0.66). (k) Cotton swab sensitivity following injection of CNO or saline in SOM-hM4D+ mice before and after intraplantar CFA. (Pre-CFA: n = 8 post-CNO, n = 8 post-saline. Post-CFA: n = 8 post-CNO, n = 8 post-saline. Pre-CFA: P (post-CNO) = 1, P (post-saline) = 0.84. Post-CFA: P (post-CNO) = 0.015, P (post-saline) = 0.60). All group data is shown as mean ± s.e.m.