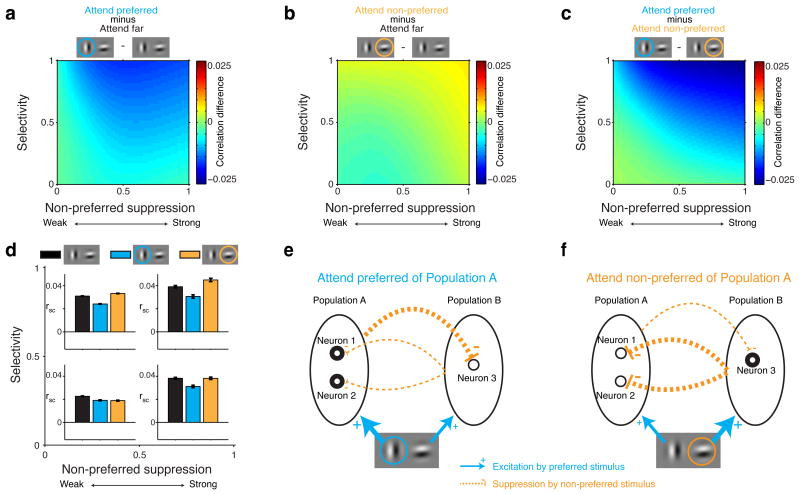
Figure 3. Visual attention engages normalization mechanisms to modulate spike-count correlations.
All data in these plots were obtained during paired stimulus presentations with attention directed to one of two RF stimuli (locations 1, 2 Figure 1b). Data are shown for neuron pairs with the same selectivity (selectivity > 0; see Figure 4 for opposite selectivity). a, Spike-count correlations decrease when the preferred stimulus is attended relative to when attention is directed far from the RF stimuli. b, Spike-count correlations increase when the non-preferred stimulus is attended relative to when attention is directed far from the RF stimuli. c, Attention modulation of spike-count correlations: comparing a and b. d, Mean spike-count correlations (rsc) computed on the data from four quadrants in the space spanned by selectivity and non-preferred suppression in a, b and c (quadrants defined by a combination of selectivity < 0.5 or > 0.5 and non-preferred suppression < 0.5 or > 0.5). Black: attention directed far from the RF stimuli. Blue: attention directed to the preferred stimulus of neuron pairs. Orange: attention directed to the non-preferred stimulus of neuron pairs. Error-bars represent ± 1 SEM. e, Attending the preferred stimulus of neurons in Population A increases neuronal activity in Population A (thick circles), which increases suppression to neurons in Population B (thick orange line). The less active neurons in Populations B (thin circles) send less common suppression to neurons in Population B (thin orange line), thereby decorrelating activity in Population A. f, Attending the preferred stimulus of neurons in Population B increases neuronal activity within Population B, which increases common suppression to neurons in Population A, thereby correlating activity in Population A.

