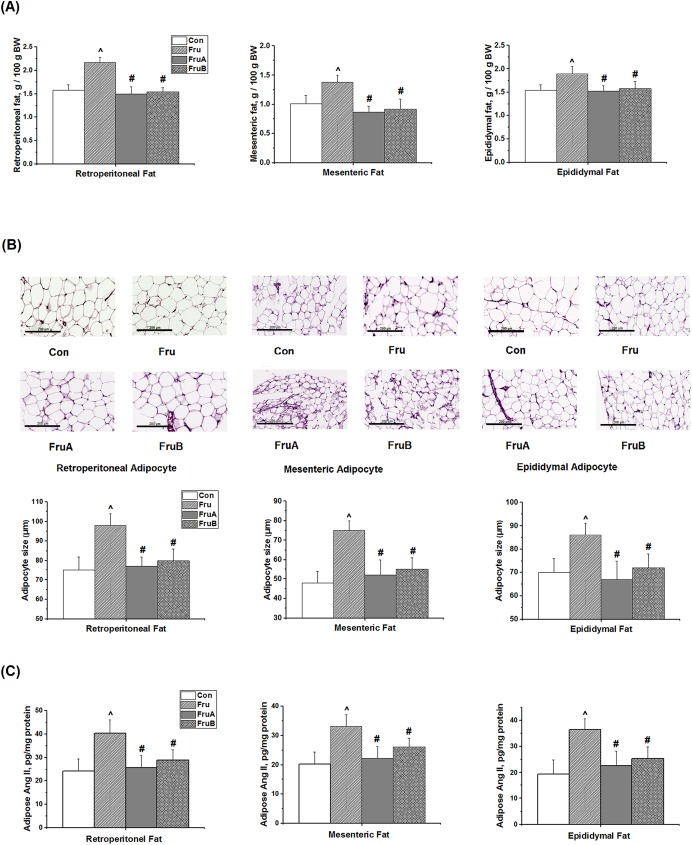
Fig 2.
Effects of aliskiren on (A) the ratio of visceral fat pad weight over the whole body weight (BW) (gram/gram, %), (B) the histological photographs and sizes of adipocyte tissues, and (C) adipose angiotensin II levels from retroperitoneal, mesenteric, and epididymal fat in fructose-fed hypertensive rats. Con: control rats were fed the normal chow diet; Fru: rats were fed the high-fructose diet for 8 weeks; FruA: rats received the same treatment as Group Fru, and aliskiren was concurrently administered; FruB: rats received the same treatment as Group Fru, and aliskiren was administered 4 weeks after the initiation of high-fructose feeding. Scale bar: 200 μm. Values are expressed as means ± SD mean of six independent samples. ^ and # denote P < 0.05 versus control rats and fructose-fed rats, respectively. N = 6 for each group.

