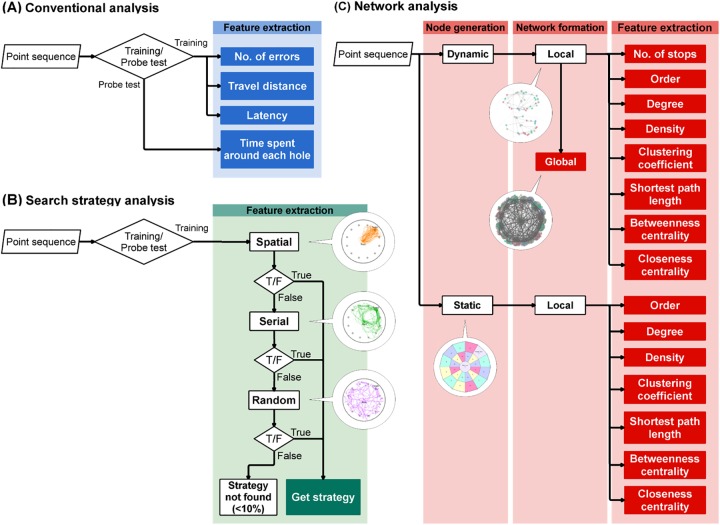
Fig 2. Processing flows of the conventional, search strategy, and network analyses.
The processing flows of the conventional (A), strategy (B), and network (C) analyses are illustrated. The analysis started from the input of point sequences, represented by the parallelogram symbol, and then executed along the arrows. The diamond and rectangle symbols represent conditional branch and particular processing, respectively. Similar processing steps are included in the larger rectangles with the processing labels on the top. The filled symbols represent outcomes. The balloons indicate representative images of processing definitions or outputs. For instance, the images in the balloons in the strategy analysis (B) indicate representative trajectories of each strategy depicted in Fig 3A. Similarly, the bottom image in the network analysis (C) indicates the static zones and nodes shown in Fig B in S2 File. The top image indicates an example of the local network, and the middle image is a sample of the global network shown (see the Materials & Methods).

