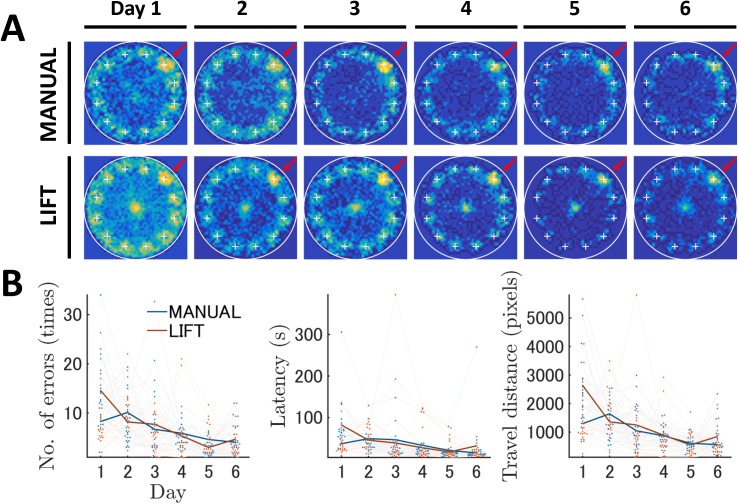
Fig 3. Analysis of the Barnes maze data from the MANUAL and LIFT entries using the conventional analysis method.
Conventional analysis revealed that spatial learning was generated in both of the LIFT and the MANUAL entries during the training phase. (A) Changes in the occupancy rate across training. The occupancy rates in each block of the field are expressed by the contour map. The top and bottom rows indicate the results of the MANUAL and LIFT entry groups, respectively. Each column indicates the corresponding training day. The occupancy rate is graded by a color map ranging from cold to warm colors. Large white circles indicate the field edge. The plus markers indicate the locations of holes. The hole markers highlighted by the red arrows are the target locations. (B) Changes in conventional features across training. The number of errors, latency, and travel distance to reach the target are shown. The dark blue and dark red lines represent the mean results of the MANUAL and LIFT entries, respectively. The value of and change in the individual mouse data are illustrated by dots and light lines.

