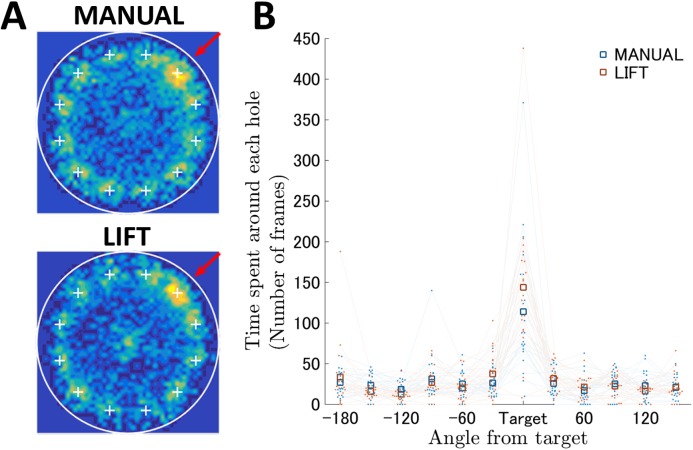
Fig 4. The probe test for spatial reference memory in the Barnes maze with MANUAL and LIFT entries.
(A) The occupancy rates in each block of the field are shown on the contour map. The results of the MANUAL and LIFT entry groups are shown. The definitions of the color code and field markers are the same as those in Fig 3A. (B) Prolonged searching time near the target hole in the LIFT entry. The horizontal axis indicates the locations of the holes expressed as angle differences from the target. The vertical axis indicates the search time for the individual hole. The blue and red squares represent the mean results of the MANUAL and LIFT entries, respectively. The value of and change in each individual mouse’s data are shown as dots and light lines. Mice in both entry groups spent significantly more time near the target hole compared with the other holes. The LIFT group mice spent slightly, but significantly, more time near the target hole compared with the MANUAL group mice (see also Table E in S1 File), indicating that more precise spatial reference memory was generated in the LIFT entry than in the MANUAL entry.

