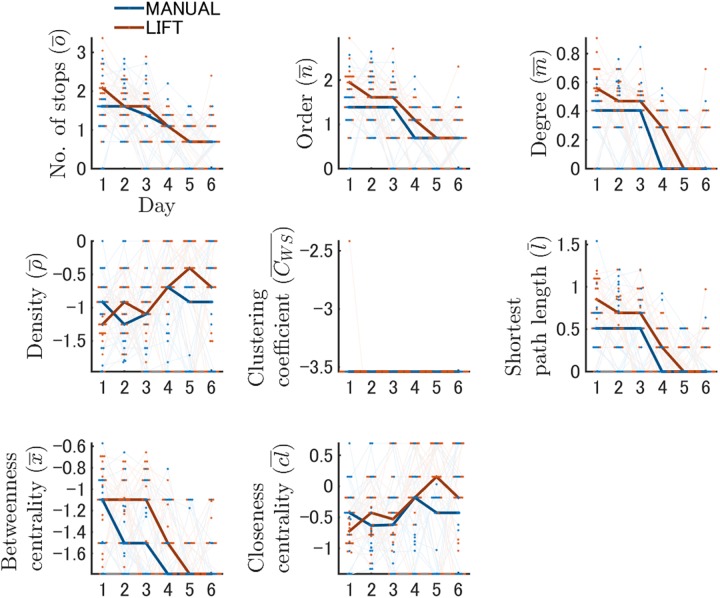
Fig 7. Learning-dependent changes in network features during training.
Network features generated by the dynamic node generation method during spatial learning are shown. The results of each network feature on a log scale are described on each individual panel. The vertical and horizontal axes indicate the values of each network feature and training day, respectively. The results of the MANUAL and LIFT entries are shown in blue and red, respectively. Bold lines represent the changes in the median values in each entry group. Red or blue dots indicate the actual values of an individual mouse in a single day, and the changes across days are depicted by light lines. Simplifying processes of network structures were quantified with temporal changes in network features, indicating that the values of network features changed more apparently in the LIFT entry than in the MANUAL entry.

