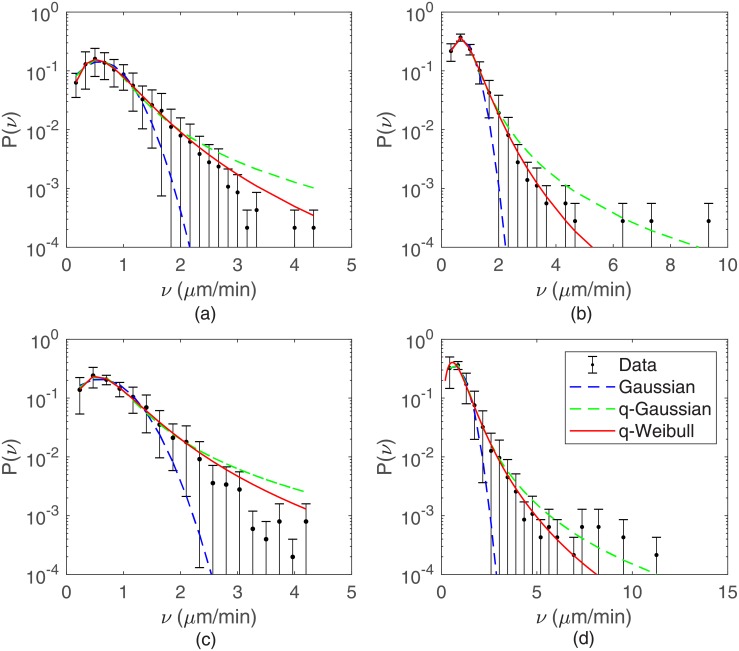
Fig 2. Ensemble speed distributions for B16F10.
Cells plated at densities of (a) 20, (b) 100, (c) 2000, and (c) 10000 cells per cm2. The solid curves are q-Weibull fits to data. For comparison, Gaussian and q-Gaussian distributions fitted to data are shown (dashed curves). The velocities for every individual cell were merged to form single large data sets. Other values than kmax = 30 were used to fix the speed bin size, generating very similar speed distributions (see S1 PDF).

