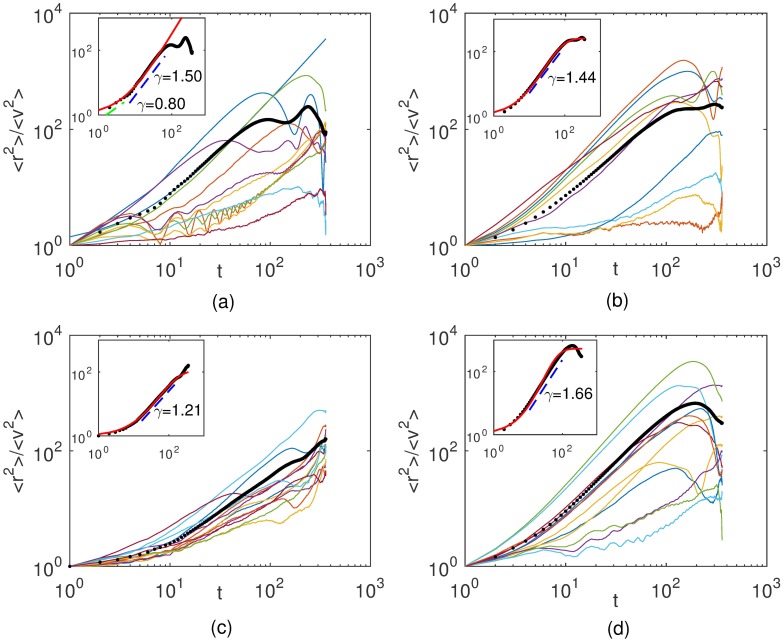
Fig 3. Mean-squared displacements 〈r2〉 as functions of time for B16F10.
Cells plated at (a) 20, (b) 100, (c) 2000, and (c) 10000 cells per cm2. The color curves correspond to distinct cell trajectories. The thick black curve is the average of all trajectories. The dashed lines are power law fits to data whose slopes provide the exponents γ characterizing the migratory regimes. Mean-squared displacements were divided by 〈v2〉 in order to put in the same scale cells with very distinct motilities. Insets: Average mean-squared displacements fitted by Eq (9). A crossover in time from a normal to a superdifusive regime is indicated.

